Free 60-min Performance Audit
Send me your Unreal Insights capture and I will tell you where your frame bottlenecks are. No strings attached, you get a written breakdown of the top issues and suggested fixes, delivered within a few business days.
The official Epic documentation on Unreal Insights is available here: Unreal Insights — Epic Games Documentation. This guide focuses on what you need specifically for this audit.
1. Use a Development build
Before anything else
The capture must be taken from a Development build, not Shipping or Debug. Shipping builds strip profiling data and named events, making the trace unreadable. Debug builds have significant overhead that will distort the timings.
2. Open the console
Getting access to the commands
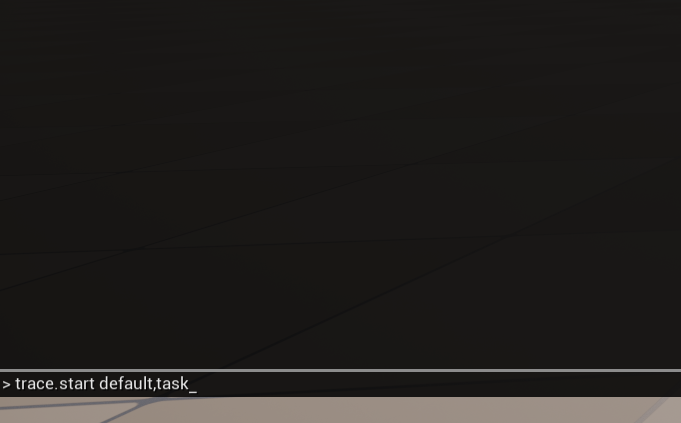
With the game running, open the in-game console by pressing the backtick or the tilda key:
` (backtick or tilda)
A text input appears at the bottom of the screen. All the following commands are typed here.
3. Enable named events
Make the trace readable
Type the following command and press Enter:
stat namedevents
This labels GPU and CPU work with meaningful names.
4. Start the trace
Begin recording
Type the following command and press Enter:
Trace.Start default,task
If you suspect your UI is contributing to the performance issues, add slate to the flags:
Trace.Start default,task,slate
To verify the trace is actually recording, type:
Trace.Status
The console should report that tracing is active and show the output file path.
5. Add bookmarks
Mark the interesting moments
While the trace is running, use bookmarks to mark the sections you want me to focus on. Open the console and type:
Trace.Bookmark HeavyScene
Trace.Bookmark AbilityX_Start
Trace.Bookmark AbilityX_Stop
Trace.Bookmark TransitionToLevel2
Use descriptive names, the label appears directly on the timeline in Unreal Insights. Add a bookmark just before and just after the problematic section.
6. Stop the trace and verify
Finish recording and check the file
Once you have captured the problematic section, stop the trace:
Trace.Stop
The .utrace file is saved to:
[ProjectFolder]/Saved/Profiling/UnrealInsights/
Open Unreal Insights (Tools menu in the editor, or launch
UnrealInsights.exe directly from the engine binaries),
click Open Trace File and load the .utrace file.
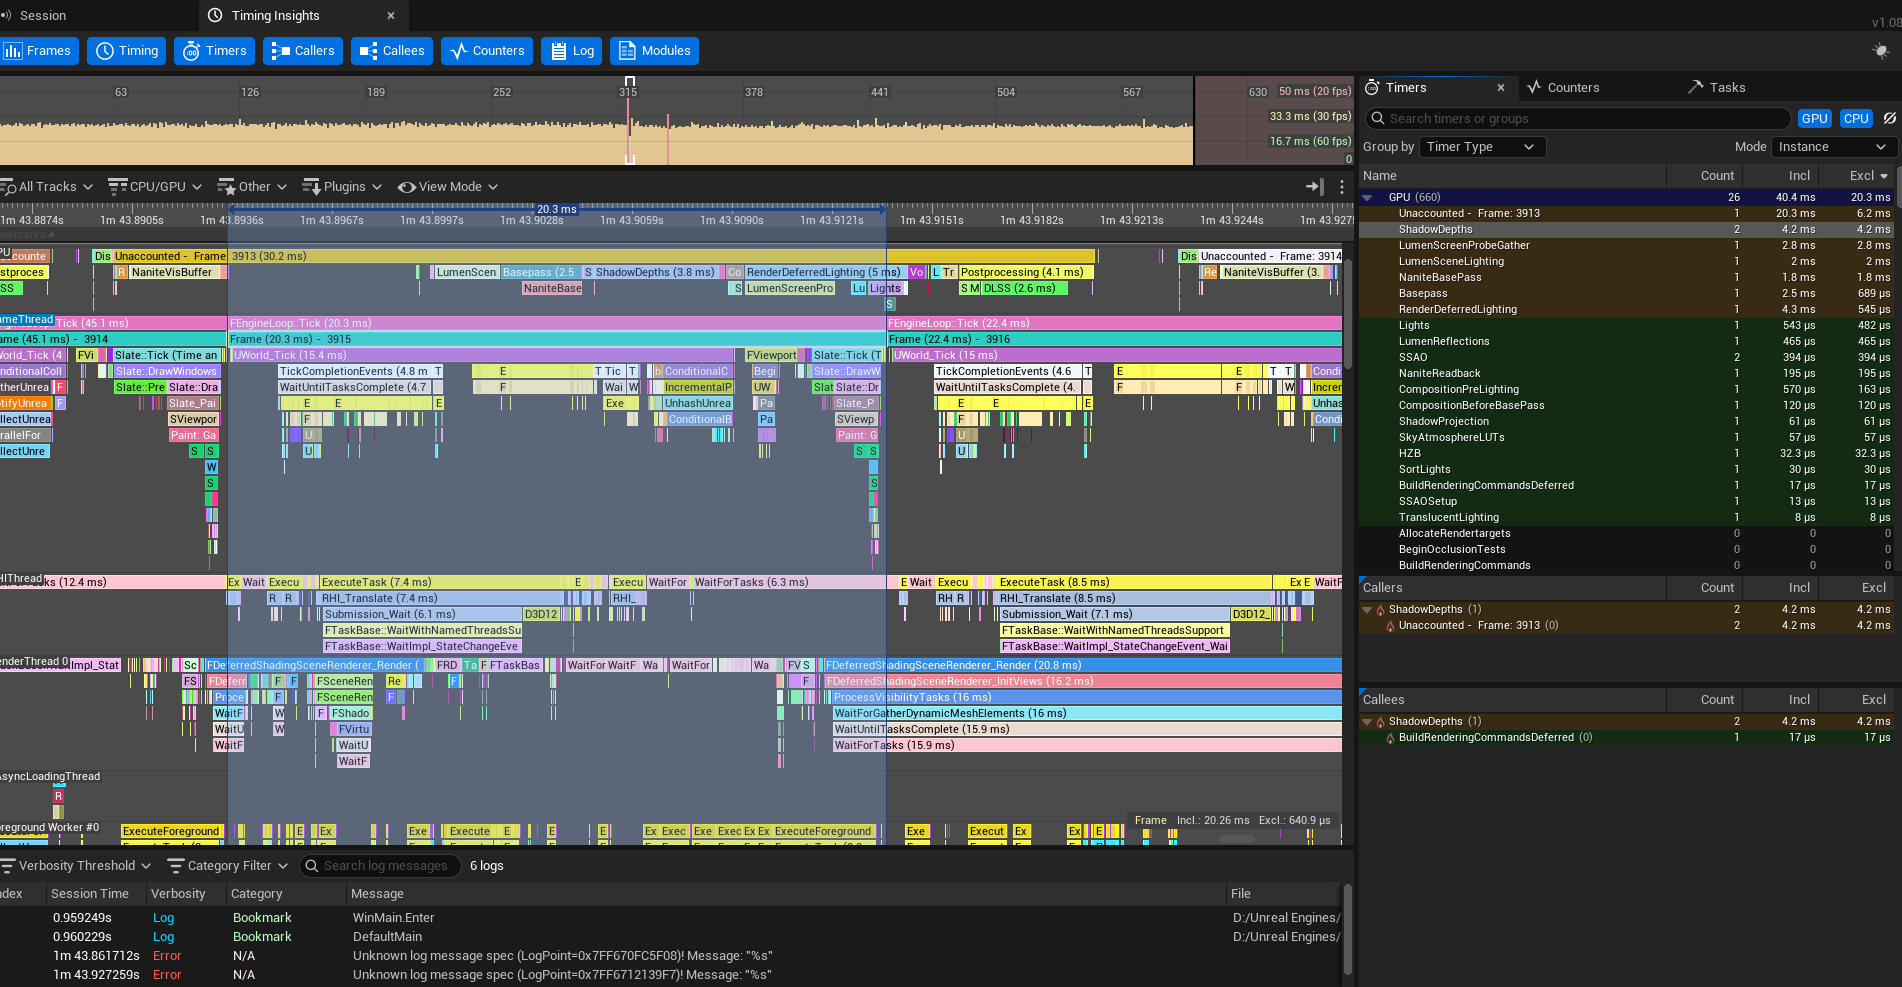
Verify that the timeline is populated and your bookmarks are visible before sending.
You should see something like this:
7. Add notes and send
Context that helps the analysis
Along with the .utrace file, include a short note with:
- Target platform and hardware specs
- Target frame rate (30fps / 60fps)
- Where you are seeing the worst drops
- Any recent changes that made things worse
- UE5 version
Upload the file to Google Drive, WeTransfer or Dropbox and send the link to:
hello@nonobit.devUse the subject line: Free performance audit — [your project name]. I will get back to you within 2 business days to confirm receipt.
This offer is limited to one session per studio. The analysis covers frame timing, rendering pass breakdown and top-priority bottlenecks. It does not include implementation work. Available while the offer is active.